With the coming of the Information Age, we found solutions to previous problems but also new problems waiting to be solved. Information abounds in digital environments but is not always easy to obtain a view of it so that we can take important decisions based on it.

For this purpose, the Business Intelligence tools promise to provide solutions for transforming the raw information data that we have.
Business intelligence (BI) represents a set of theories, methodologies, architectures, and technologies that transform raw data into meaningful, and useful information for business purposes.
The BI purpose is to handle enormous amounts of unstructured data in order to identify, develop and create new opportunities. It”s saying that images are a better way to describe something than words are. The human mind understands the graphical explanation, more than the theoretical one.
In order to make a decision, our information needs to be displayed with a proper presentation in terms of charts, reports, scorecards, etc. Initially, the data warehouse concept was just about keeping historical data. Nowadays, a data warehouse is a foundation for BI.
Business Intelligence consists of an increasing number of components which include the following:
- Multidimensional aggregation and allocation
- Denormalization, tagging and standardization
- Realtime Reporting
- Interface with unstructured data source
- Group consolidation, budgeting and rolling forecast
- Statistical inference and probabilistic simulation
- Performance indicators
- Version control and process management
BI is made up of several related activities, including data mining, online analytical processing, querying and reporting.
Examples of companies that are using BI tools are restaurant chains. They use BI in order to make strategic decisions like the new products they should add to their menus, which dishes should remove, which underperforming stores should they close, when they renegotiate contracts with the food suppliers and when they try to identify new opportunities to improve the inefficient processes.
Microsoft BI Tools
Among all the different software vendors from all over the world, Microsoft seems to be the only one authorized to claim that it delivers “Business Intelligence for everyone”. This is how Microsoft advertises its new Business Intelligence platform. Microsoft used all the experience it has gained delivering the operating systems and office suites for end-users while designing the Business Intelligence platform.
The Microsoft BI platform consists of the most useful tools that are operated from a truly intuitive interface. The platform is composed of these three solutions – Microsoft SQL Server, Microsoft SharePoint, and Microsoft Office. The main strength of the Microsoft Business Intelligence platform is that almost everyone knows how to use it, and knows its components and the interface is”t something new for the users.
Microsoft Business Intelligence platform supports reports and analysis, preparing and sharing it with other users across the organizations. What truly is important for today”s companies is the time needed for data to spread inside the organization. The shorter, the better, and the Microsoft solution is perfect from this point of view.
Microsoft BI platform can be used for:
- Preparing dashboards. Dashboards prepared within the Microsoft solution are fully interactive; therefore one can quickly dive into each area of data to watch it from another point of view and find out something more.
- Stimulating collaboration. Efficient collaboration is very important to all modern organizations and the Microsoft Business Intelligence platform supports it with well-developed communication capabilities. It allows all users across the organization to work on the same version of data boosting their performance.
- Self-sufficient reporting and analysis. The wide reporting and analytical capabilities of the Microsoft Business Intelligence platform allow users to prepare and modify reports and analyses. The working environment is then secure and intuitive, so no specialists need to keep an eye on the system.
- Data mining and predictive analysis. The platform provides tools that help to automatically analyze data from different points of view and discover trends.
- Data warehousing. Microsoft Business Intelligence platform provides ETL (Extract, Transform, Load) processes and supports data segregation and warehousing.
PowerPivot and SQL Server Analysis Services (SSAS)
PowerPivot and SSAS are current Microsoft tools for the BI market. Microsoft does not have currently a BI product but gives people a reason to upgrade to MS Office 2010 or MS Office 2013 and promotes the idea of a self-service BI. The Microsoft BI stack is based on multiple tools like Excel 2013 and SQL Server Analysis Services and components like Microsoft PowerPivot. In order for users to get MS Excel Dashboards many companies to hire BI consultants. The back-end API of PowerPivot is available only packaged with SharePoint and SQL Server. This means that enterprise users will need consulting services to integrate all these moving parts.
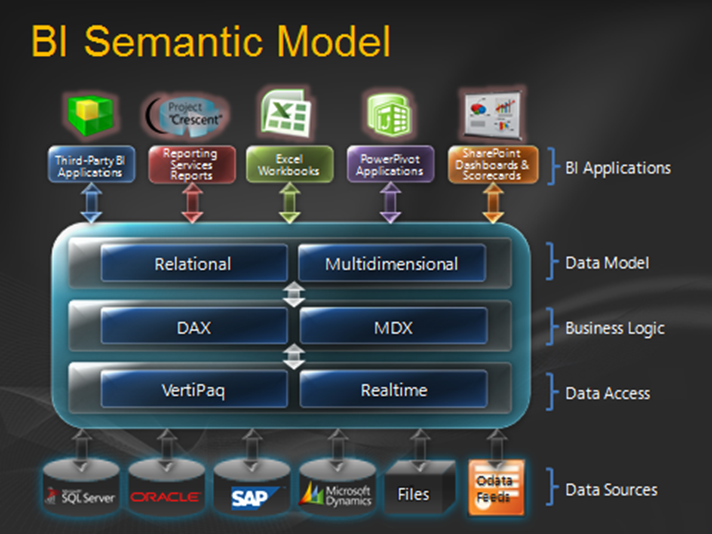
Business Intelligence Semantic Model (BISM)
In addition to Excel, SSAS, SSRS and PowerPivot, Microsoft published a new roadmap with a new BISM model in Analysis Services that will power Crescent (upcoming Microsoft Data Visualization technology) as well as other Microsoft BI front-end experiences such as Excel Dashboards, Reporting Services and SharePoint Insights.
When a BI Developer creates a PowerPivot application, the model embedded inside the workbook is also a BI Semantic Model. When the workbook is published to SharePoint, the model is hosted inside an SSAS server and served up to other applications and services such as Excel Services, Reporting Services, etc.
Data Integration or ETL (Extract, Transform and Load) Pipeline
An organization might have one or more different types of applications catering to the needs of the organization”s functions. When we discuss designing and developing a Data Warehouse as part of the Business Intelligence System we also need to define the strategies for data acquisition from all the source systems and integrate it into a data warehouse.
SQL Server Integration Services (SSIS)
Microsoft SQL Server Integration Services (SSIS) is an ETL platform for enterprise-level data integration and data transformation solutions and a component of the SQL Server platform. SSIS provides the ability to have a consistent and centralized view of data from different source systems and helps to ensure data security through integration, cleansing, profiling and management. SSIS offers a fast and flexible ETL framework and has in-memory transformation capabilities for extremely fast data integration scenarios. SSIS has several built-in components to connect to standard data sources (RDBMS, FTP, Web Services, XML, CSV, EXCEL, etc.), along with a rich set of transformation components for data integration.
Analysis
Once the Data Warehouse is created and data integration components load data into the Data Warehouse, next you need to create an OLAP multi-dimensional structure. Microsoft Business Intelligence system can leverage SSAS (SQL Server Analysis Services) for making data available for analytics and reporting. SSAS, as a leading OLAP tool, delivers online analytical processing (OLAP) and data mining functionality for business intelligence applications. SSAS pre-calculates summarizes and stores the data in a highly compressed form, which eventually makes the reporting and predictive analysis extremely fast and interactive exploration of aggregated data from different perspectives.
Data Mining
Data mining models created in SSAS can help to identify rules, patterns and trends in the data. In this way, the users can determine why things happen and predict what will happen in the future. SSAS has already included several data mining algorithms as box capabilities. SSAS also lets you define KPIs (Key Performance Indicators) to your SSAS cube in order to evaluate business performance over time against the set target, as reflected in the cube data. Normally, the front-end reporting is provided by data through SSAS cubes. These cubes aggregate data, and through cache management features optimize the query results. The predefined queries have a quicker response time than summarizing these from the underlying data sources every time users query them.
Information Delivery
When SSAS cubes (multi-dimensional structure) are done and populated with the data from Data Warehouse, different reporting tools can be used to analyze the data from different perspectives or dimensions.
SQL Server Reporting Services (SSRS)
SQL provides a full range of ready-to-use tools and services to help create, deploy, and manage reports for organizations. Reporting Services include programming features that enable the extension and customize the reporting functionality. You can create tabular reports as well as different varieties of chart reports, graph reports, maps, or geographical reports. In addition, KPI-based scorecard reports can also be created.
PowerPivot, Power View, Excel services and SSRS provide users with the ability to both define and execute ad-hoc reports from a standard data model. By using the SSAS cube, users have the ability to analyze reports in a flexible manner based on the exposed measures and dimensions.
Collaboration and hosting platform
SharePoint 2010 or 2013 can be used as a collaboration, hosting and sharing platform; the reports and dashboards will be all deployed or hosted by a SharePoint portal. SharePoint is one of the leading products for enterprise content management which provides collaboration, social networks, enterprise search, business intelligence, etc. capabilities out of the box.
It”s not mandatory to have SharePoint as the reporting user interface because you can very well have SSRS reports deployed on the report server. SharePoint hosting platform offers several out-of-the-box features like Performance Point services for creating nice looking dashboards, which provide out-of-box drill down, drill path and decomposition. Further, Excel and PowerPivot services can be used for deploying Excel or PowerPivot to SharePoint in order to make it available to other people, turning Personal BI into Organizational BI.
SharePoint’s built-in security features allow role-based security. SSAS also allows defining role-based security as well as cell-level security. These security roles or cell-level security will govern data access and ensures that the right person has access to the right information at the right time.
Conclusions
The Business Intelligence field is in continuous development. These technologies are at the beginning of a long journey in a world where the key to success lies in the ability to make better decisions in a shorter time than the competition. Microsoft did a step on this path and created a set of products that enable a new vision for this area. I”m waiting to see what will happen further, probably the next step will be Artificial Business Intelligence.